In February this year, I wrote a journal post that there may be a History Making Event on the Horizon. This week’s blog will update where the equity markets are with respect to that event.
You may wish to reread that well-liked article by clicking on the link above. Well, the event did occur, the Dow Jones Industrial Average and S&P500 indices have both broken above their previous all-time highs. For the record, so did Germany’s DAX.
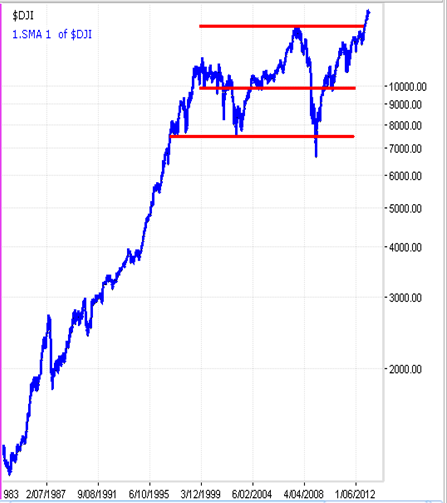
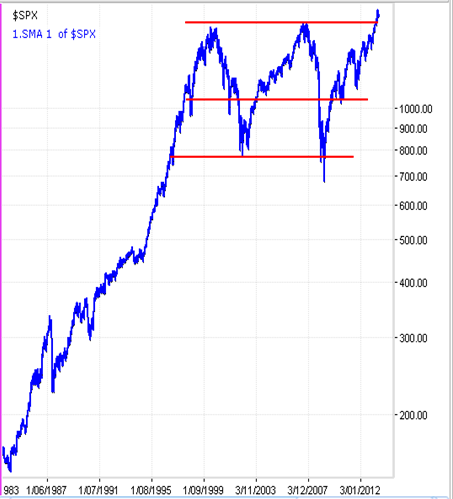
Technically, this breakout event is a breakout of the secular bear market that I spoke of back in February this year. The two charts below show the breakout of the DJIA and S&P500, respectively.
At the time I stated that there was a high probability that this would occur. But I also stated that what occurred after the breakout is what would be really interesting. Let’s discuss the “where to” scenarios.
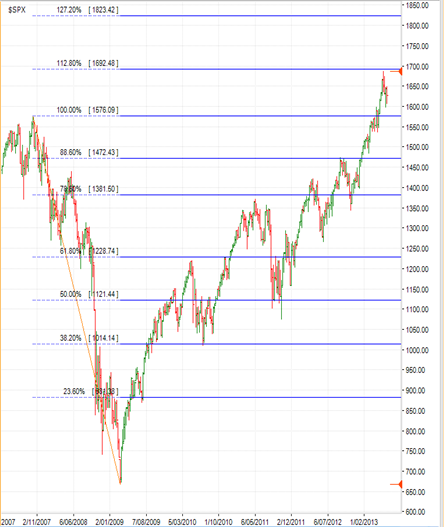
Firstly, ranges expand. And when they do, false breakouts can occur. We will not know whether this particular breakout is a range expansion (a false breakout) for a few months yet. In my research, range expansions can extend to 112.8% and as far as 127.2% of the previous range (even further on occasions) and then fall back into the previous range, meaning that the index will fall well below the previous high (1576.09 on the S&P500 in this case).
A 112.8% extension was achieved (or close enough to qualify) on the S&P500 when it peaked at 1687 on 22 May. A 127.2% extension in this case could take the S&P500 up to the 1820 – 1825 zone, some 12% above the current level at time of writing.
If this is indeed a false breakout of the secular bear market then a retracement back into the secular bear range will occur and could go as deep as the 1120 zone, which is around the midpoint of the secular bear range. Whilst this would be a severe retracement and a lesser one is anticipated in the ‘false breakout scenario’, the worst possible case for the false breakout scenario would be a full, or near full, retracement to the bottom of the range to around the 700 level! This is a low probability outcome at this stage and would require some pretty horrid doomsday events to unfold over the next couple of years as current fundamentals don’t support such an outcome.
In any case, this outcome would be a continuation of the secular bear market for a few years to come yet, maybe another five or so to take the secular bear to its full term of around 18 years according to the theoretical 17-18 year market cycle.
However, if it is not a false breakout and indeed is an end of the secular bear market then support should be found at or around the previous high of 1576, or just below it, followed by a new high above 1687 and then again above 1823. This would indicate a strong primary bull market and one that investors of all kinds should partake in. This is the second possible scenario.
Such a scenario could see a 2 year or so continuing primary bull market (we are currently smack in the middle of one!!) on equity indices well into 2014 (and maybe beyond) with the S&P500 reaching well over 2100 or over 35% above current levels (but not in a straight line!).
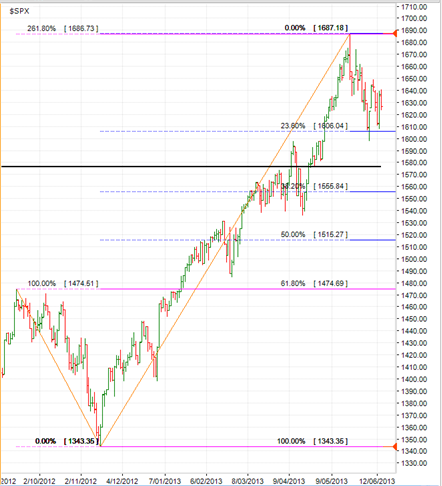
A hybrid scenario, the third scenario, and one that could have many variations, is that a retracement occurs back into the secular bear market range, but not too deep, before the trend continues up. How deep would be determined by the retracement of the previous run-up to the recent high at 1687.18 on 22 May.
The chart below shows this run-up. It also shows the possible retracement levels to 1606, 1555 and 1515 at the 23.6%, 38.2% and 50% retracement levels, respectively. The solid black horizontal line is the previous all-time high. A 38.2% or 50% retracement will take the S&P500 back into the secular bear market range (i.e. below the previous all-time high).
Any one of these retracements could occur and the long term trend that started back in October 2011 would still be intact. The less the retracement before a new high is achieved (if it is) the stronger the medium term trend will be proven to be and potentially the higher the equity indices could go before the next major retracement, which will be the next primary bear market.
Note, too, that:
- A 61.8% retracement level (1474) is almost precisely the peak of the previous run-up. Reaching this level too is a possibility before continuing up but will indicate more weakness in this primary bull market.
- The Fibonacci projection of the retracement on the bottom left of the chart was almost precisely a 261.8% extension (1686.73). It certainly was time for the S&P500 to have a breather!
Similar analysis could be conducted on the DJIA and the DAX. I have used the S&P500 for this analysis as it is a proxy for sentiment in general terms for equity indices around the world. It is nigh on impossible for other world equity indices to rise if USA equity indices are falling strongly, so the first step is that USA equity indices are currently showing strength.
I know that whenever a retracement occurs and market volatility rises, investors get very nervous. Fear takes over as bad news is magnified and good news is discounted. Investors over-react to minor events.
It is important during such times to keep looking at the big picture and keep putting market moves into context. Having an objective decision support process helps overcome fear and making indecisive and knee-jerk moves in the market.
Hopefully you can see that the recent downward move on the S&P500 is still relatively shallow and that a rise from here to a new high will be very positive. Of course things can change and as things do one’s process should pick up the adjustments and react accordingly without hesitation, reservation or indecision.
