How a Proper Trader Performs
This presents the live, real-money track records of our mechanical trading systems, alongside common market benchmarks over defined time periods.
All results show starting capital, dates, and calculation rules.
2016–2025 ASX (equal-weight)
SPA3 compounded at 13.05% p.a. vs 9.87% for the index, growing $80k → $266k with a max drawdown of −22.7% (index −35.9%).
As of 15/10/25:
SPA3 positions are filled, ~89% invested, $25.9k cash, $26.5k open profit at risk. Edge intact, risk defined.
From 2016–2025, SPA3 Investor compounded at 13.05% p.a. vs the market’s 9.87%, turning capital into ~3.3× with a shallower drawdown (-22.7% vs -35.9%) a positive-expectancy, rules-based edge built on bigger winners, smaller losers, and disciplined execution.
SPA3 Investor Report
ASX Equal-Weighted
(1 Jan 2016 → 15 Oct 2025)
(results shown are for this period and market; past performance ≠ future returns.)
SPA3 Investor
US Equal-Weighted
(1 Jan 2016 → 15 Oct 2025)
2016–2025 US (equal-weight):
SPA3 compounded to $214k from $70k (12.10% p.a.) with a max DD −36.7%; it trailed the index (15.01% p.a.) but maintained a positive-expectancy, rules-based profile.
As of 10/15/2025:
SPA3 has 10 out of 10 Positions, ~100% invested, $22.98k open profit with ~$4k locked by stops. Risk defined, edge intact.
2016–2025 US: SPA3 compounded at 12.10% p.a. (≈3.1× capital) across 403 trades with +0.35R expectancy, but underperformed the index (15.01% p.a.) and experienced a -36.7% max drawdown.
Winners were ~2× losses and held ~3× longer. This remains a rules-based, positive-expectancy approach that requires discipline through streaks and drawdowns.
(period and market specific; past performance isn’t a guarantee of future results)
Simulation Result
ASX Stocks - SPA3 Investor Equal Weighted Simulation
(with $9.50 brokerage fee and 9 positions 100K)
This 3-year stretch favored buy-and-hold a touch. SPA3 still delivered a double-digit CAGR (+11.9%), with controlled drawdown (−14.3%), positive expectancy, and a healthy dividend + franking boost (~$13.9k, ~34% of total profit).
The edge remains the same: cut losses, let winners run longer, take every signal. You won’t outrun the index every slice—but you stay in the game with defined risk and let the math compound.
You outpaced the index decisively with lower pain per unit of return. The engine is clear: roughly half your trades win, but winners are ~2.3× the size of losers and are held much longer.
That’s a +0.59R edge—big enough to compound without drama, provided you keep doing the boring work: take every signal, cap losses, never negotiate with exits.
You crushed the index over 10 years, compounding to ~7.5× while taking far smaller drawdowns. The engine is textbook SPA: just over half the trades win, but winners are ~3× the size of losers and are held much longer—driving a +1.12R expectancy.
Keep doing the boring, professional work: take every signal, cut losses, let winners run.
(period and market specific; past performance isn’t a guarantee of future results)
USA Stocks - SPA3 Investor Equal Weighted Simulation
(10 positions with no brokerage fee 100K)
In a strong U.S. tape, SPA3 kept up and slightly edged the index while running a solid +0.85R expectancy. You took more drawdown than buy-and-hold at times, but the engine is clean: half the trades win; winners are ~2.7× the losers and held ~3× longer.
Keep doing the boring work: take every signal, cut quickly, let trends pay.
You kept pace with a strong U.S. market and edged it with less pain per unit of return. The engine is clean: about half the trades win, but winners are ~2.3× the losers and are held much longer. That’s a +0.63R expectancy—good enough to compound so long as you keep doing the boring, professional work: take every signal, cut quickly, never negotiate exits.
You turned $100,000 → $682,854.63 (Oct ’15–Nov ’25) with a max DD −23.04% vs the index’s −33.79%, powered by +1.30R expectancy. 56.42% of trades win, winners are ~3.07× losers and are held ~161 vs 56 days.
Keep doing the boring, professional work—take every signal, cut quickly, never negotiate exits.
(period and market specific; past performance isn’t a guarantee of future results)
Beyond Charts: Smarter Tools for Smarter Investors
Beyond Charts gives you the power to analyze, test, and manage investments with confidence. Combining professional-grade tools, customizable charts, and high-quality data trusted by serious investors.
Powerful Features Designed to Help You Invest Better

Advanced Market Scanning
Filter thousands of securities with precision using technical and fundamental criteria to spot opportunities fast.

Professional Technical Charting
Customize charts, overlays, and studies across time frames to visualize market movement clearly.

Beyond Charts Formula Language (BCFL)
Turn ideas into strategies with BCFL. A scripting language 99% compatible with MetaStock for advanced analysis.

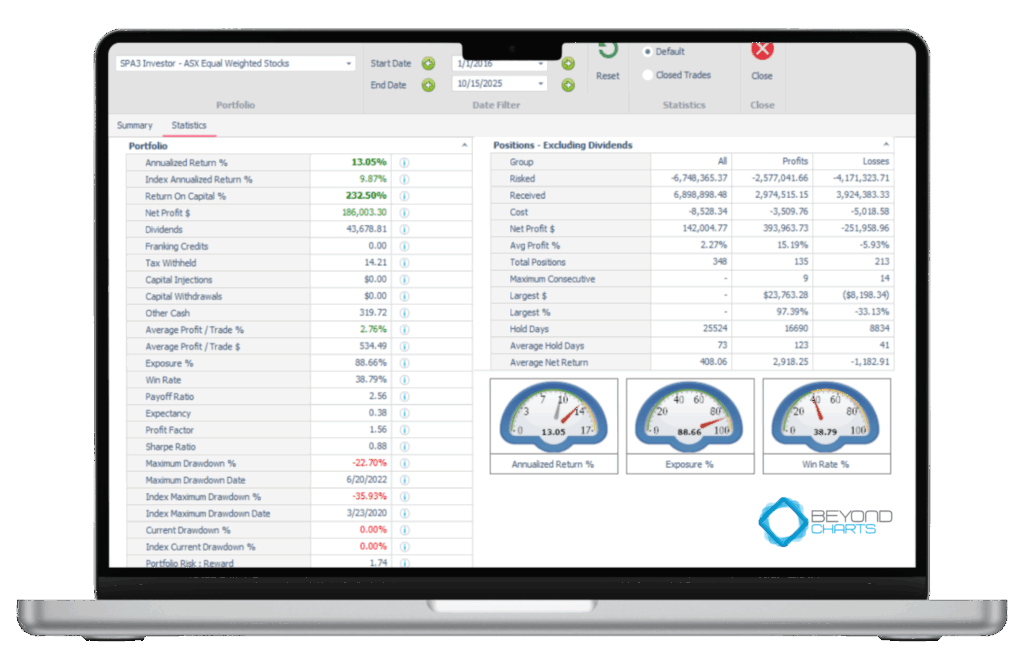
Realistic Trading Simulator
Test and refine your strategies in live market conditions without risking real capital.

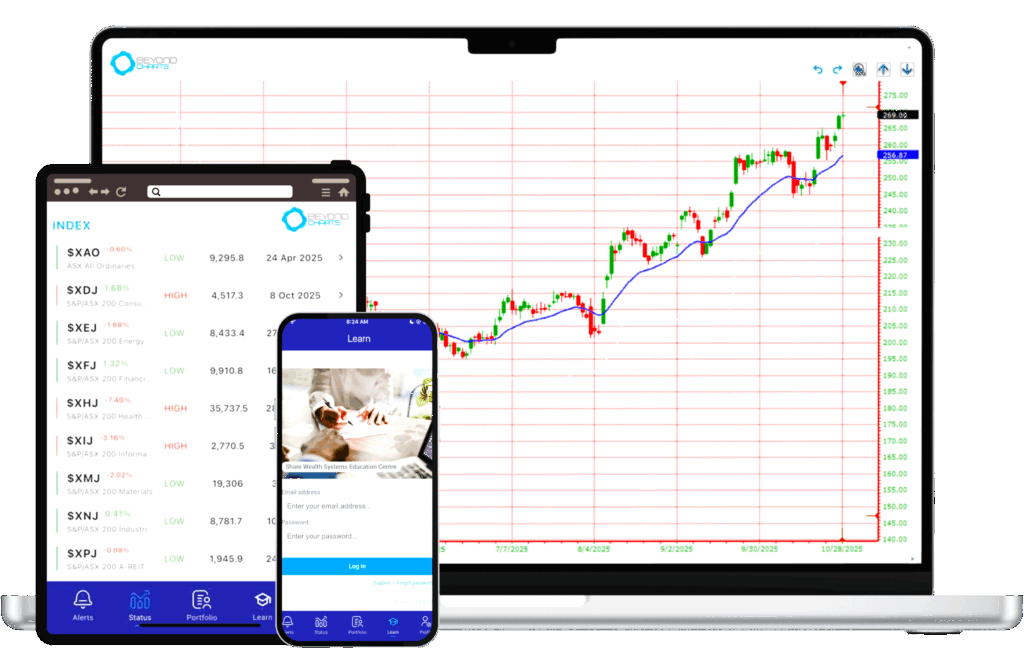
SWS Alerts to Stay Ahead Anywhere
Get real-time buy, sell, or stop alerts on your phone or tablet so you can act instantly.

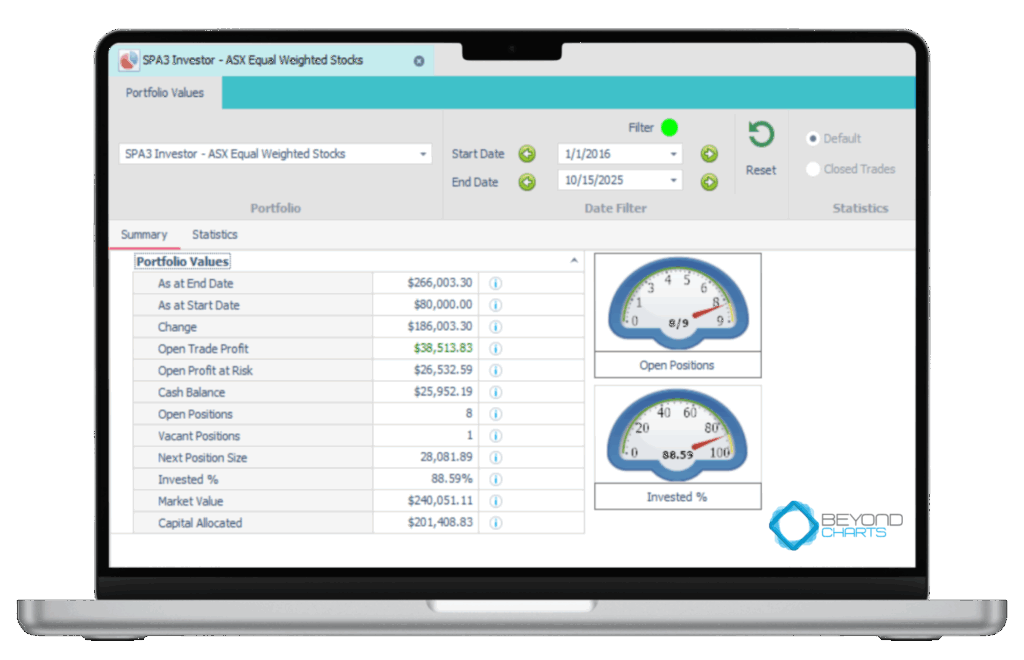
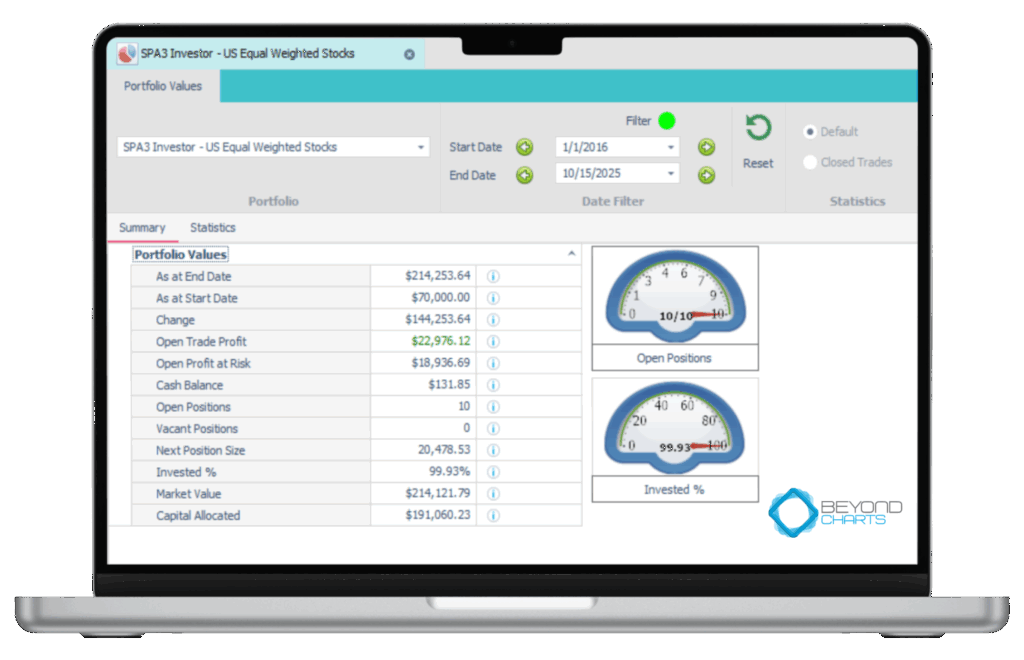
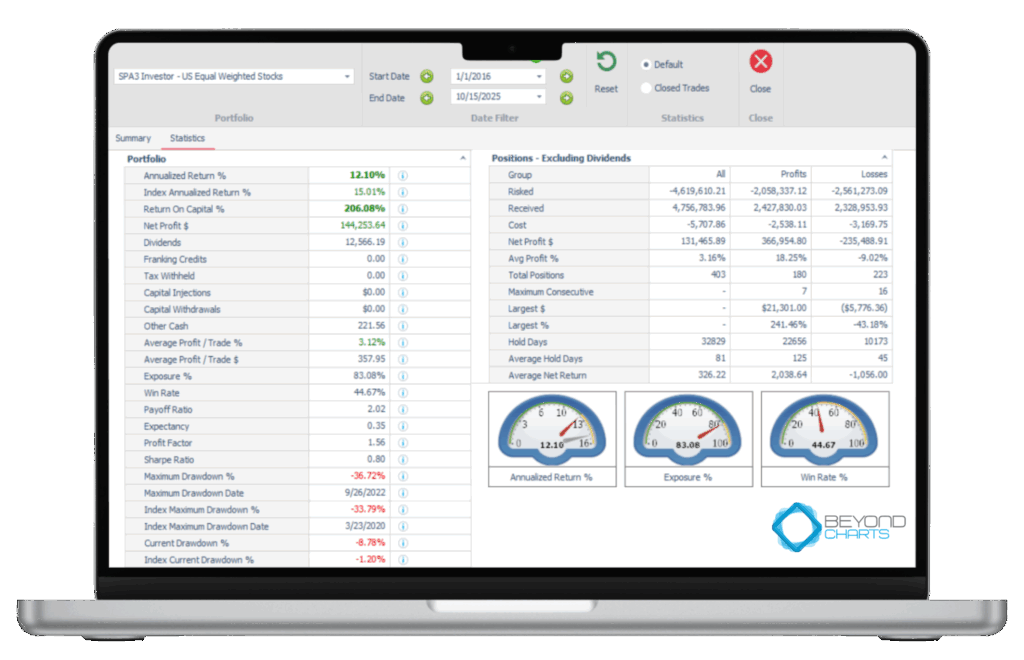
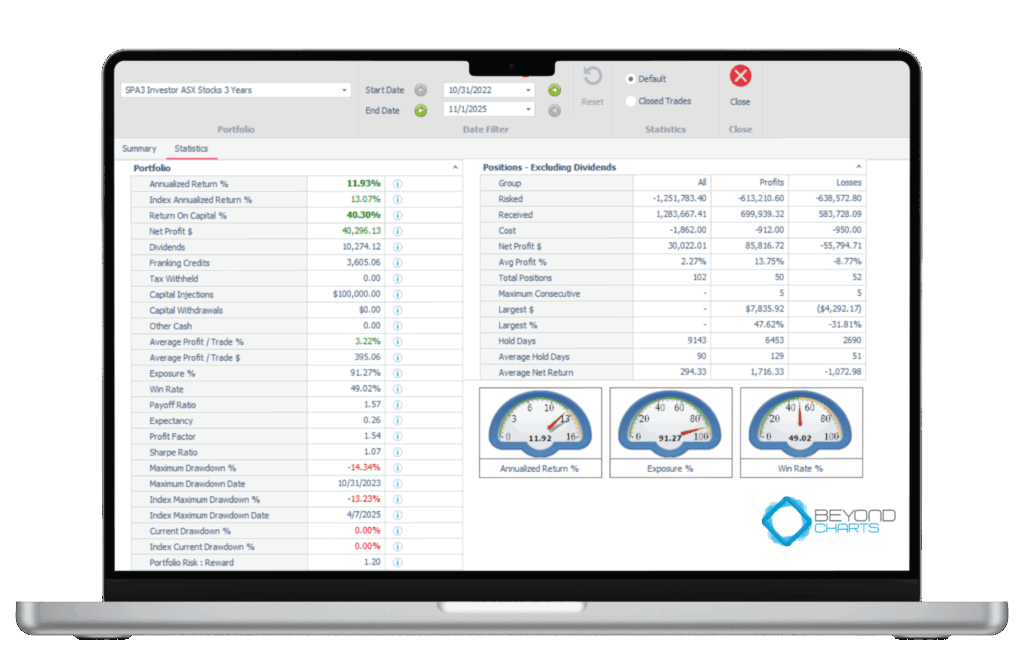
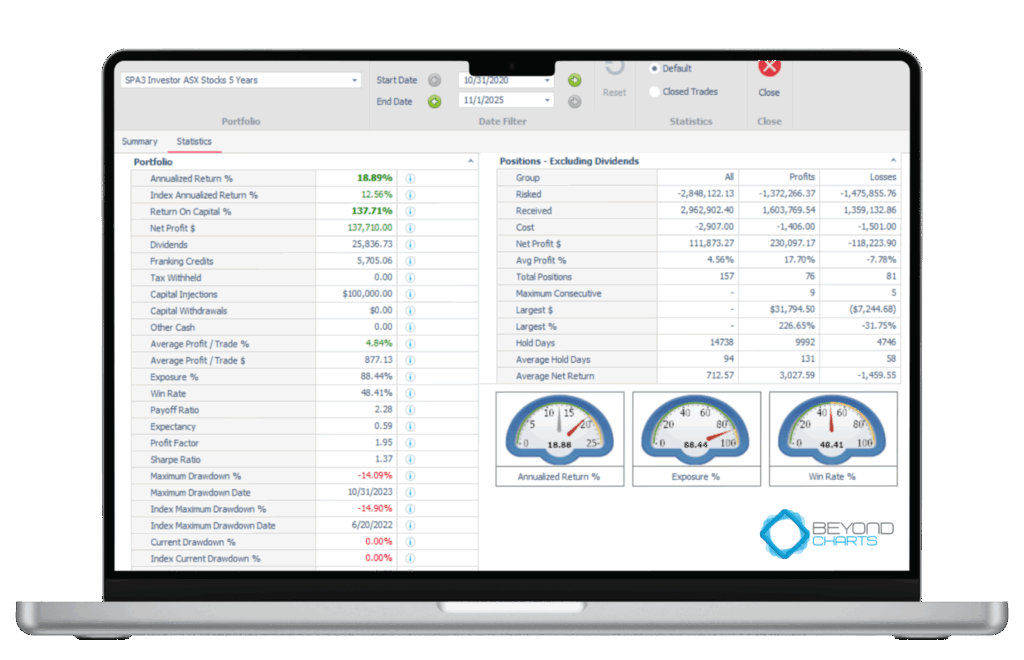
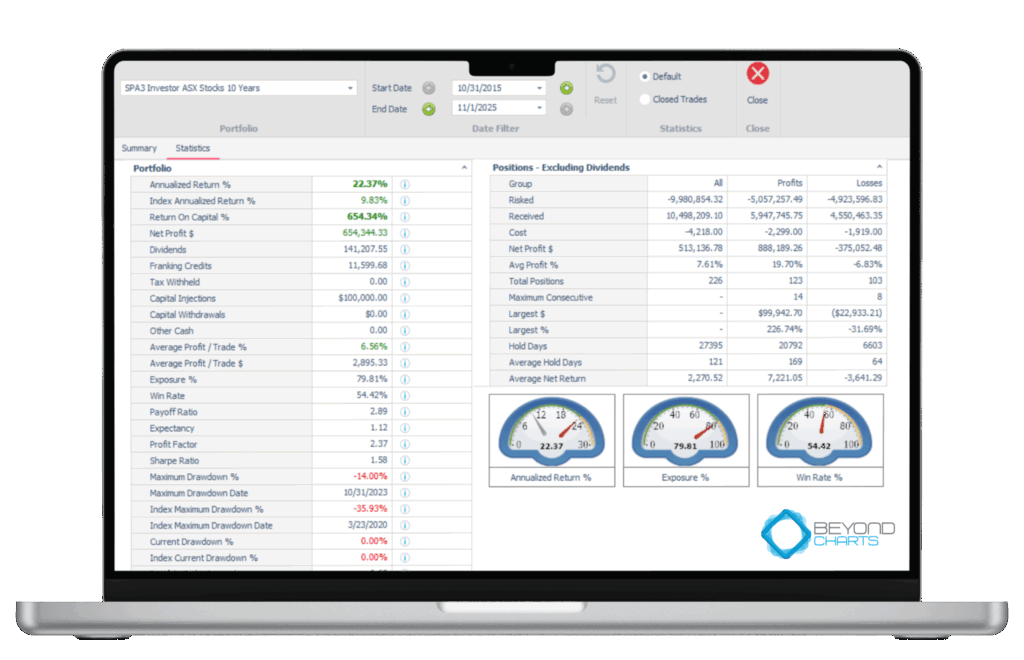
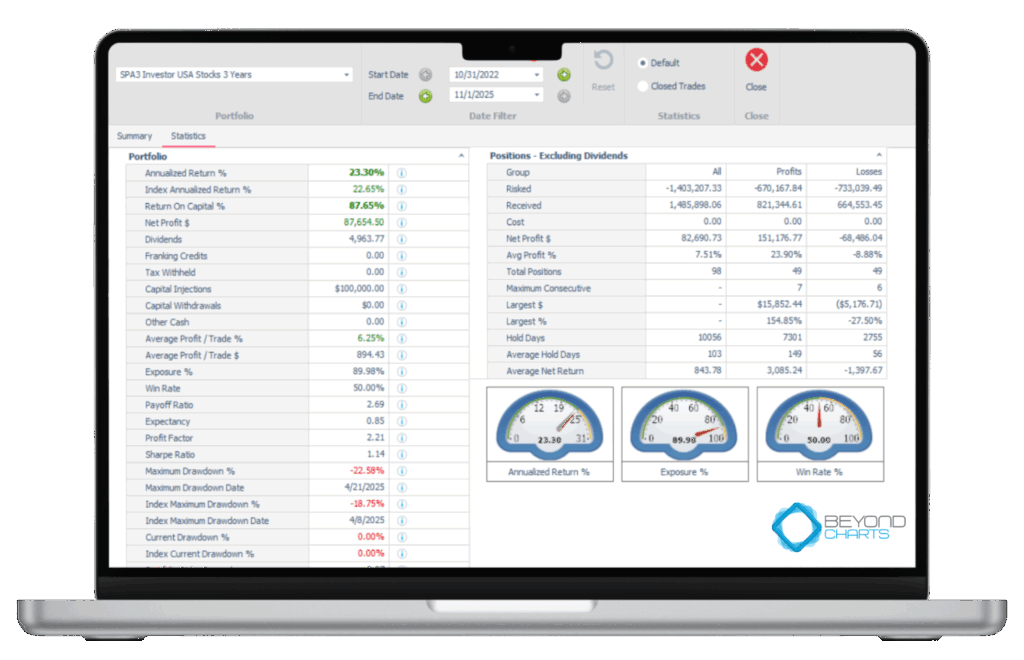
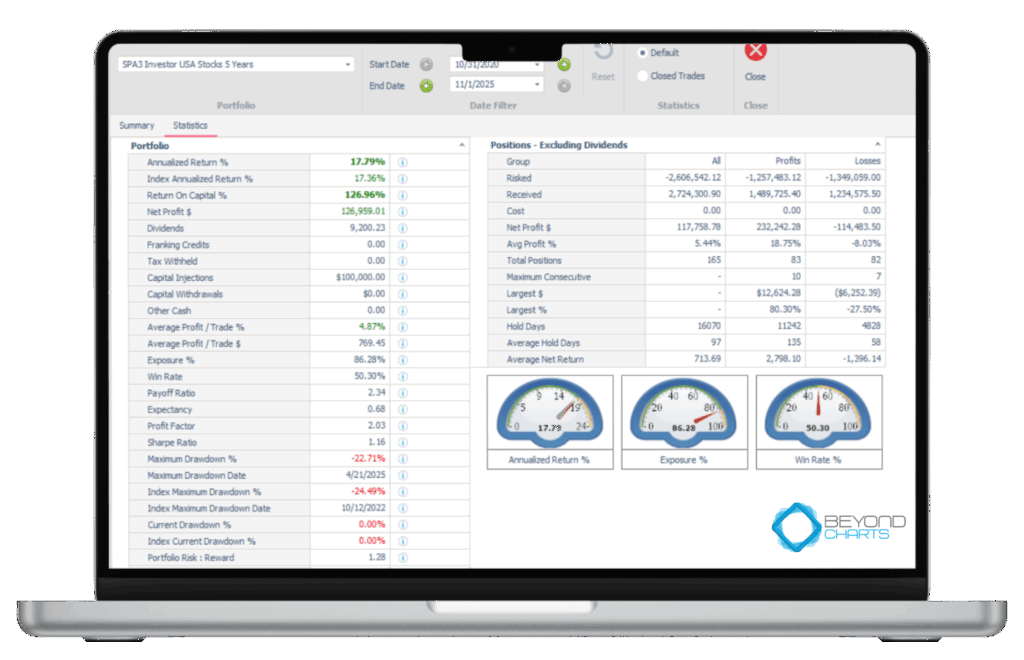
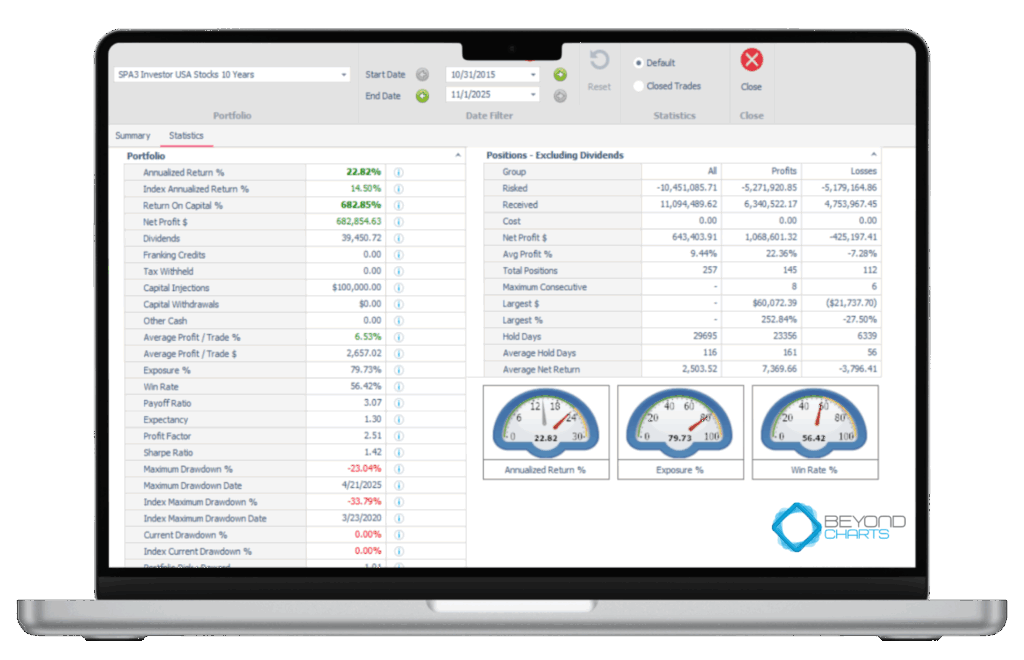
Smart Portfolio Management
Easily track, analyze, and manage both live and paper portfolios in one place.

Watchlist & Workspace Manager
Organize your market view with custom watchlists and saved workspaces that auto-load your preferences.

Data You Can Trust
Rely on premium, accurate market data powering every scan, chart, and backtest.
Performance vs. the Market.
The Reality Behind the Numbers
Why SPA3 Sometimes Trails
It deliberately moves to cash during downtrends and early rebounds a strategic “safety tax” that safeguards capital and preserves long-term performance.
Market benchmarks like the Nasdaq are cap-weighted, meaning a handful of mega-caps can periodically drive returns that diversified, equally weighted systems won’t mirror.
Being a longer-term trend-following system, long periods of sideways moving markets will cause SPA3 to trail the index, which gets its returns mostly from dividends during these periods
Why SPA3 Shines
It cuts losses trades while they're small and keeps winners longer than losers—the essence of positive expectancy.
Over time, that consistency compounds with far less emotional chaos, creating smoother, steadier performance.
During severe 50% to 80% bear markets, such as 2001, 2008 and the COVID-Crash, SPA3 will be mostly in cash, thereby avoiding most of the drawdown that causes big losses in the Index and ETFs.
Feedback From Our Customers