For those building a system I can only commend you for taking on such a challenging and potentially rewarding task. It must be said that it is not for everyone as the skills and focus required for developing an edge are somewhat specialised and niche. The 4000 plus hours I invested into SPA3 has taught me this and I have a Maths and Computer Science background which made the task somewhat more achievable. Furthermore, this is what I do and hence have time, focus and resources around me to enable the completion and ongoing maintenance of an edge. I say this as the majority of people who make a decision to develop a system never actually complete it and hence never really get to trade it.
For those interested in buying an edge the equation below may seem less important. But you should have the knowledge to be able to assess any business in the financial services space that may provide advice to you (newsletter, broker, tipster, investment manager,systems provider etc) by asking the question “what is your edge”?
They should be able to prove to you that they have x amount of winners and y amount of losers and that the winning trades are z larger than the losing trades, over a large sample of trades, regardless of what analysis approach they use. At the very least, if a company cannot do this then you should seriously consider not investing money in their strategy or approach. There are other metrics that should be sought but we’ll leave that for another time.
Now that you have a better appreciation from past postings that an edge is needed, the next step is to understand exactly when an edge is good enough to trade profitably and also when there is no edge (i.e. a losing approach).
The first thing we need to know is at what point an edge becomes positive i.e. the minimum threshold.
This break-even point is a Mathematical Expectation (ME) of 0. Outcomes less than 0 lose money and greater than 0 make money.
Let’s use a coin toss example to illustrate what we mean by a break-even edge. If, for whatever reason, over a large sample of coin tosses, we only win 20% of the tosses we would need to win $4, on average, with our winning tosses if we lost $1, on average, for every losing toss, just to breakeven. Mathematically:
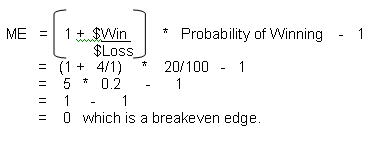
We call the 20% in the above example the Win Rate. We call the average dollar win divided by the average dollar loss the Profit Ratio, i.e. 4/1 = 4 is the Profit Ratio.
Using this formula, the Profit Ratio required to achieve a breakeven threshold for a given Winning Rate can be calculated as follows:
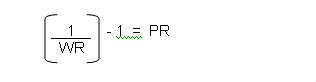
where WR = Winning Rate and PR = Profit Ratio.
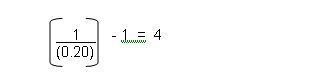
In the above example where the Win Rate is 20% the Profit Ratio to breakeven, as we now know, would need to be:
For example, if 34% of closed trades are winners, what Profit Ratio is required to reach breakeven?
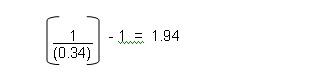
This means that the 34% of winning trades would, on average, need to be 1.94 x larger than the losing trades, after trading costs, to break even. A Profit Ratio greater than 1.94 would mean, over time, that your closed trades would be showing a net profit.
So depending how often a trading approach wins, the Profit Ratio defines how much bigger the net profit for winning trades, on average, must be than the net loss for losing trades, on average, so that you breakeven or better.
Any edge that is better than breakeven will make money over time provided that sensible money management is used. For example, if all capital is placed on single trades this could lead to disaster over a small sample of trades.
The Breakeven Table below shows, for a given Win Rate, how much a winning trade, on average, needs to return for an average loss of 1 unit.
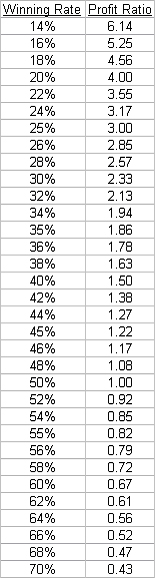
As you can see from this table it is possible to make money with an edge that has 84% losses provided the profits are on average more than 5.25 times the size of the losses. Just about all of us would, of course, find it extremely challenging to trade such an edge.
Those that prefer a diagram, the one below shows a solid black line that depicts a breakeven edge. Note that the final edge that you trade should include brokerage, commissions and slippage.
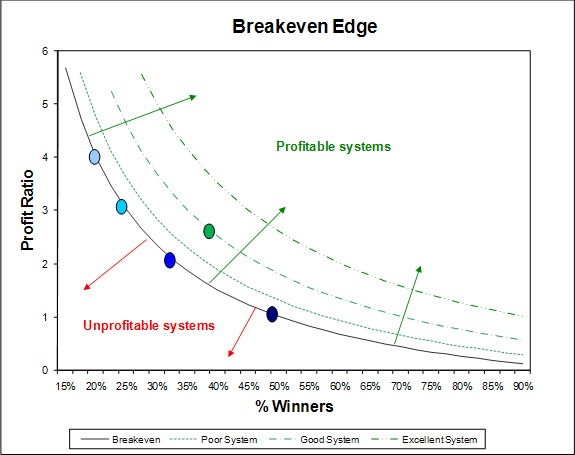
The leftmost dot (also the uppermost one) on the breakeven line is positioned at a winning rate of 20%. A profit ratio of four will be required to break even, net of brokerage and slippage. The rightmost dot on the breakeven line is positioned at 50% where a Profit Ratio of one will be required to break even, net of brokerage and slippage.
The green dot positioned on the “Good System” line is SPA3.
Any system with an edge that falls below the breakeven line has a negative mathematical expectation and hence virtually no probability of being profitable over a large sample of trades. Through luck, over a small sample of trades you may make money, but the more trades you complete with a negative mathematical expectation system, the higher the probability that you will lose money. Absolutely no type of money management rules can save such a system over a large sample of trades.
Any system positioned above the breakeven line can make money. The further away from that line, the higher the probability that not only will it make money but also that it will be profitable from a smaller sample of trades. Also, the further away from the breakeven line, the less volatile the system’s equity curve should be and the steeper the equity curve should be. This means lower drawdowns while making money faster.
A good system does not need to be that far away from the breakeven line to make good money as the power of compounding is on your side when you have a positive mathematical expectation working for you in the market. I use the word ‘can’ rather than ‘will’ because poor money management rules will undo an edge with a high positive mathematical expectation as will poor trading psychology.
In reality, generating a system that is at or further away than the ‘Excellent System’ line will be difficult to achieve. If you do, there may be a high probability that the system is either overly optimised and hence curve fitted to a narrow price action dataset, or has too many criteria and filters which means the same thing. It is overly optimized by constraining its degrees of freedom. This may also occur with a system that trades infrequently, i.e. the historical testing generated a small sample of trades. Again, this usually results from too many criteria and over optimising.
There are many other metrics that could be established to compare one edge to the next that we won’t go into here and now.
There are a few terms that are not defined above that we can leave for another day but in the meanwhile it is important to understand the need for an edge, what an edge is, where the breakeven line is and where your system is relative to it, over a large sample of researched or live-traded trades.
