Last week we looked at the potential upper and lower limits for ASX dividend re-investing buy and hold portfolios. I posed the question of how systematic risk can be mitigated and how the worst case stock selection can be avoided.
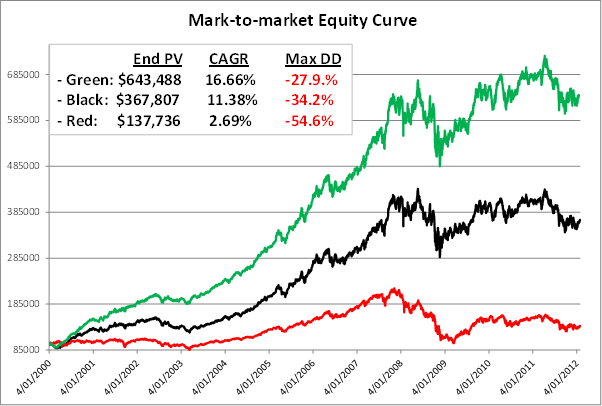
Before getting into these answers we should quickly explore the difference that re-investing dividends makes in a long term buy and hold portfolio. Remember, receiving a dividend is like manifesting cash from thin air which are immediately deployed back into the market. This is the performing 10 stock portfolio from last week where the black equity curve excludes dividends and the green includes dividends.

That’s a 75% improvement in returns by re-investing dividends! In the 20 stock portfolio discussed last week the improvement in returns was even more stark, $543,526 to $1,018,049, or 87%! For the poorly performing 10 stock portfolio the improvement was 99% from $75,139 to $149,931. Remember that re-investing dividends also increases your shareholding which means that your returns are compounded.
This seems too good be true. But it can be better.
Of course, there are the minor requirements that you pick the right stocks and that you stay the either distance in these stocks through thick and thin regardless of what ‘noise’ you are subjected to over the years, or you have a timing mechanism to exit and re-enter them appropriately.
Let’s look at systematic risk. Systematic risk is the risk that a portfolio is subjected to due to negative sentiment towards the overall equities market. The reasons for the negative sentiment could be anything ranging from geopolitical, terrorist activity, inter-market movements, wars, natural disaster and even reasons that may not exist yet! Some last a few days and others for months or even years.
Using a timing mechanism to mitigate systematic risk can improve performance dramatically. More importantly it can be very liberating knowing that you have an objective shut off value should sentiment become too negative, regardless of the reason.
So let’s revisit the same three portfolios from last week and see how using a simple systematic risk management timing technique can potentially improve performance. I decided to use a very simple and delayed timing technique to minimise effort for the near-passive investor. The emphasis on simple and ensuring that the passive investor did not need to become too active.
The approach is to close down the portfolio and go 100% into cash when the All Ordinaries fell below its 200 day exponential moving average for five consecutive days and to re-enter the market when the All Ordinaries rose above the same EMA for two consecutive trading days. This simple timing mechanism would have resulted in 17 portfolio exits into 100% cash over the 12 years. Using a simple rather than exponential moving average would have resulted in 8 portfolio exists into 100% cash.
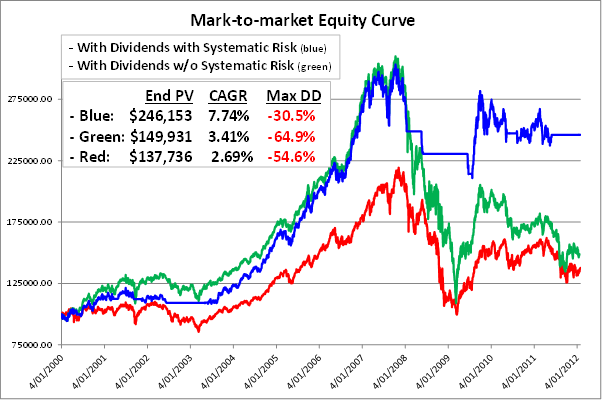
The difference that this would have made for the poorly performing 10-stock portfolio is quite dramatic, a 64% improvement! And what about the huge improvement in the pain measurement, maximum drawdown, more than halved down from 65% to 31%? The red line is the All Ordinaries index.

Let me put the green equity curve into perspective by pointing out again that the red equity curve, the All Ordinaries, can be used as a proxy for the average equity managed fund’s performance over the same period, including managed fund fees! This means that even the green equity curve above, as poor as it seems, would have outperformed most equity managed funds!
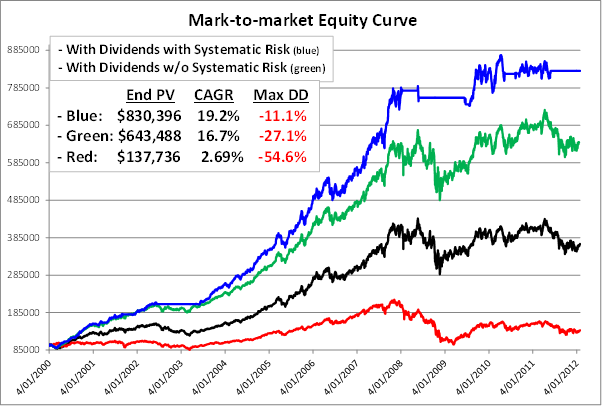
With the performing 10-stock portfolio the improvement from deploying a simple systematic risk management strategy over the 12 year secular bear market period would have been 29.1% in returns and a huge reduction in maximum drawdown from -27.1% to -11.1%!

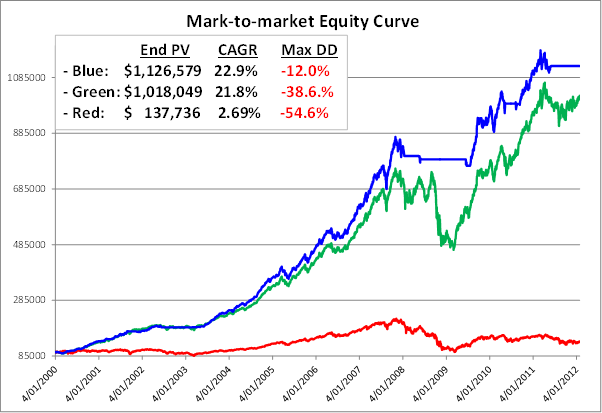
With the performing 20-stock portfolio the improvement from deploying a simple systematic risk management strategy over the 12 year secular bear market period would have been 10.7% in returns and a huge reduction in Maximum Drawdown from -38.6 to -12%!

The portfolios that used systematic risk timing exclude interest returns (3 blue equity curves above) when the portfolio was 100% in cash. Interest on cash would have further improved performance of these portfolios by an estimated 7% – 8% over the life of each portfolio scenario through raw return and compounding.
Notice the massive growth in the green equity curve in the 20-stock portfolio from early in 2009. This was mainly due to the lesser stocks in this portfolio such MND, RHC and ALQ. They started rising early in 2009 while the blue equity curve was still 100% in cash.
Many investors would have (and did) close down their portfolios on the way down during 2008 and probably did not re-enter the market until well into 2009, if at all, missing out on a large part of the 2009 run-up.
Looking at all three scenarios, an observation may be that the better the stock picks the less improvement that systematic risk management seems to have.
However, this is with just one fairly delayed near-passive market timing mechanism and with possibly the best hindsight selected 20-stock portfolio available on the ASX over the 12 year period.
What if a slightly more sensitive market timing mechanism was used where there were more occasions and earlier in the down cycle over the 12 years that the portfolio was moved 100% to cash.? Or a different not-so-good portfolio was selected?
This is the realm of research that one should embark on to answer such questions. The point is that even with the simplest and least sensitive of timing mechanisms, an investor with the inclination to do so can derive significant benefits by putting some focus into systematic risk management rather than only dividend paying stock selection.
Next week we look at the most important question to answer in this series on this subject which is: “How can I, in advance, eliminate the fairly good chance of selecting a poorly performing long term portfolio, even if I re-invest dividends?” That is, remove the possibility of the worst case outcomes, or close to them.
