This blog continues on from last week where I posed the question: “How can I, in advance, eliminate the fairly good chance of selecting a poorly performing long term portfolio, even if I re-invest dividends?”
There are two approaches of ensuring that one does NOT experience portfolio performance similar to the poorly performing 10-stock portfolio discussed over the last 2 weeks and, even worse, ensuring that it is not worse than that.
The first is ensuring that your stock selection, many years in advance, is simply brilliant. The second is to become more active either by introducing systematic risk management, exiting and selecting different stocks over the lifetime of your portfolio or becoming a more active momentum investor. Or a combination, to some degree, of all three.
The first approach, relying on brilliant stock selection, is fraught with risk because it is difficult in the extreme to know what is going to happen so far into the future, as has been shown in the previous two blog postings. The second approach requires active investment to some degree or another.
The scenario of introducing systematic risk management was covered last week. The scenario of exiting and selecting different stocks with the same position size as the exited stock during the lifetime of the portfolio wouldn’t have improved the best scenario as we had already, with the benefit of hindsight, selected the best stocks over the period.
Moving out of the poor stocks into the better stocks during the life time of the portfolio could have improved the worse-case scenarios. Easier said than done. Unless you have a specific process devised, based on much research and reading, you may make more mistakes and make the situation even worse.
Let’s investigate the active momentum approach. The main benefits of such an approach are:
-
One does not need to be a brilliant stock picker in advance. With active momentum investing the stocks pick you as they come to the fore.
-
More sensitive systematic risk timing mechanisms are used ensuring that one is 100% in cash during most of the primary bear markets and even some secondary bear markets.
-
The worst case momentum investing scenario is far far better than the worst case for picking stocks. This is the main benefit as I will show below.
-
More active momentum portfolios will perform better than long term stock picking portfolios putting the odds in the favour of the active investor.
-
One picks up fantastic financial skills along the way.
The main disadvantages of active momentum investing relative to a long term stock picking approach are:
-
It takes more time to manage an active momentum portfolio.
-
One has to learn the psychological aspects of active investing and to stick to their plan. Whilst some view this as a disadvantage, to most active investors this is seen as a positive by-product of the active investment process.
Having established the upper and lower limits over the previous two blogs for buy and hold portfolios that re-invest dividends, let’s now explore the outcomes of an active momentum strategy that uses systematic risk management, stock timing and simple but sophisticated money management.
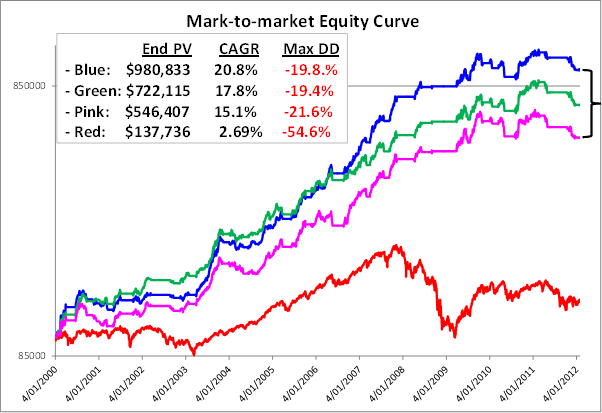
The graph above shows the 5 (blue), 50 (green) and 95 (pink) percentiles of a 1000 portfolio simulation over the same 12 years as the buy and hold portfolios but now using an active momentum strategy where the average hold period per trade is around 6 weeks. The straight horizontal lines are when the portfolio was in cash.
The active momentum portfolios above do NOT include interest and dividends which would obviously only further improve returns.
The CAGR to Maximum Drawdown ratios (CAGR ÷ Max DD), which are an excellent method for calculating the rewards received for the risks taken, are simply outstanding.
These portfolio outcomes could realistically have been achieved by active investors that followed the same simple processes that are used in the simulation. Indeed, investors using this active strategy should perform somewhere between the blue and pink equity curves.
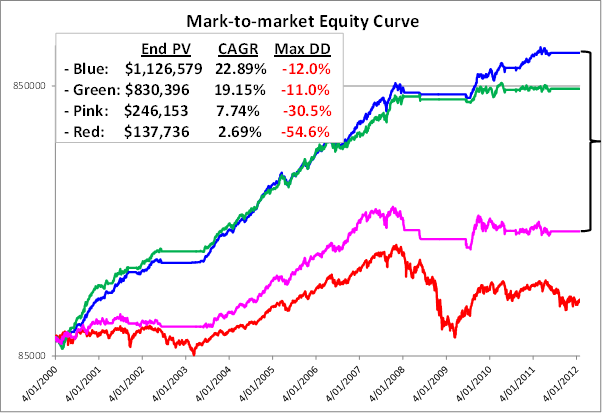
Now compare this to the same upper and lower limit chart for the buy and hold portfolio that re-invests all dividends firstly without systematic risk and then with systematic risk.
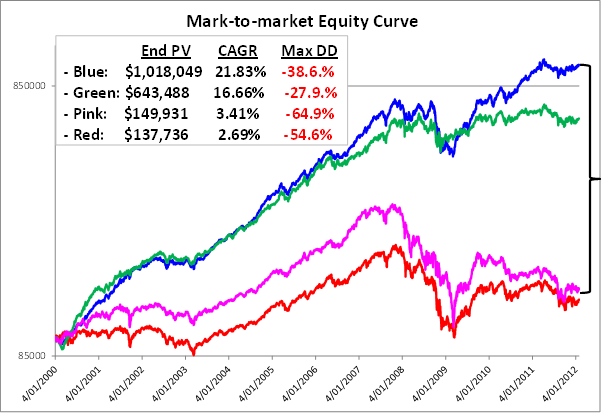
Remember, the blue equity curve is a near best possible portfolio that has used the benefit of hindsight to select the best performing and dividend paying stocks over the 12 year period. It omitted all poor performers and, hence, is an unlikely outcome for almost all buy and hold investors. Refer to the posting two weeks ago for the list of stocks that comprise this portfolio and their individual performances over the 12 year research period.
The first glaringly obvious observation is how much better the worst case outcomes are for the active momentum portfolios compared to the long term portfolios with dividends re-invested. This answers the prime question posed for this blog.
The second glaringly obvious observation is the massive difference in the gaps between the blue and pink equity curves in the three charts. This means that the potential to achieve better returns are well and truly there for active momentum investors without needing to take the huge risk of being wrong with the tough caper of having to select the right stocks in advance.
The daily process for deploying the active momentum strategy is 10 – 15 minutes a day. A small price to pay for peace of mind that removes the pressure of having to select the best performers many years in advance and eliminates the possibility of experiencing the pain of a large drawdown such as the 2008 primary bear market.
This concludes this four part series on this subject.