In February this year, I wrote one of my most well-read and distributed blogs entitled “History Making Event on the Horizon”. Feel free to read it again right now.
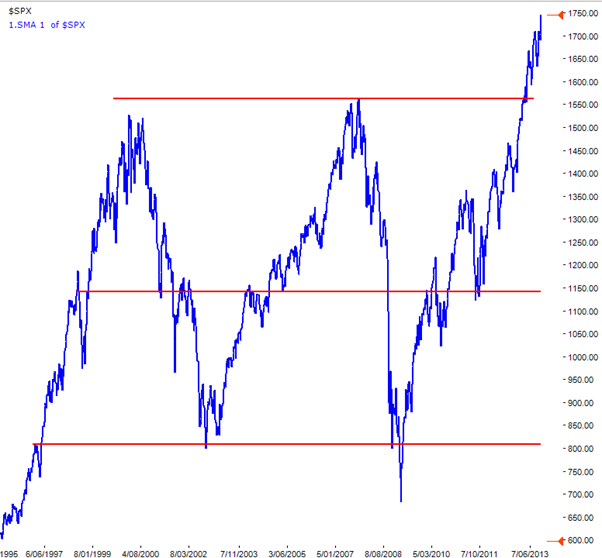
The event discussed was the potential breakout by the S&P500 of a 13+ year range to a new all-time high thus potentially signalling:
- the end of the secular bear market that started, with the benefit of hindsight, in the United States in March 2000, and
- the start of a new secular bull market.
The breakout event first occurred on 10th April 2013.
Looking back to November 2012 when the current trend in the S&P500 started – following a 60% retracement of the previous trend just prior to November – the S&P500 has followed a text book up trend with higher lows and higher highs. For the technically minded, the five retracements in this trend to each higher low has been very close to a 23.6% Fibonacci retracement. To have five retracements in a row with such shallow retracements indicates how strong this trend has been. It has now been going for a few weeks shy of a year.
The S&P500 made its latest new all-time high on Thursday last week 17th October. The following day the All Ordinaries reached a new 5+ year high at 5322, a level last seen on 30th June 2008! The breakout event and its ensuing follow through is seen clearly on this daily chart of the S&P500.
The fundamentals driving this market that I mentioned in the blog in February are still very much in place. In fact, I omitted one back then, which was the most obvious one, and I will add another driver in this blog that is probably one of the biggest giveaways why there is a high probability that we might just be in the infancy of this secular bull market.
The one that I omitted to mention in February is the ongoing “printing of money” by the USA Federal Reserve. That combined with the Fed keeping interest rates at near 0% levels supports the long-time held view to “Never fight the Fed.”
The other new point to add to the ‘for camp’ to support this being the start of a secular bull market is that there are very very few private investors and “Mum’s and Dad’s” talking about, let alone participating in, the equity markets at the moment. This is the case in the United States and even more so in Australia where participation is just about at all-time lows. This is one of the biggest clues as to why this bull market has some way to go, probably well into 2015 and maybe further.
The equities market will be euphorically overbought and ready for a large correction when shares and stocks, and I mean the really specie ones too, are being discussed at dinner parties and in the elevator, and cabbies and the kebab man have a view.
The equity markets may have just started the phase that leads to a raging bull market. The task of the investor is to become sufficiently savvy to ensure that they get a juicy chunk of any trend that may ensue but, more importantly, to ensure that they have a risk management strategy in place not to be caught in any major correction that might follow thereafter or along the way.
To answer my “Now what?” question let’s look to the past, which is not filled with a large sample of secular bear to bull market transitions but can give us some clues. In October 1950 the start of the secular bull market and the ensuing 10 years looked like this on the S&P500.
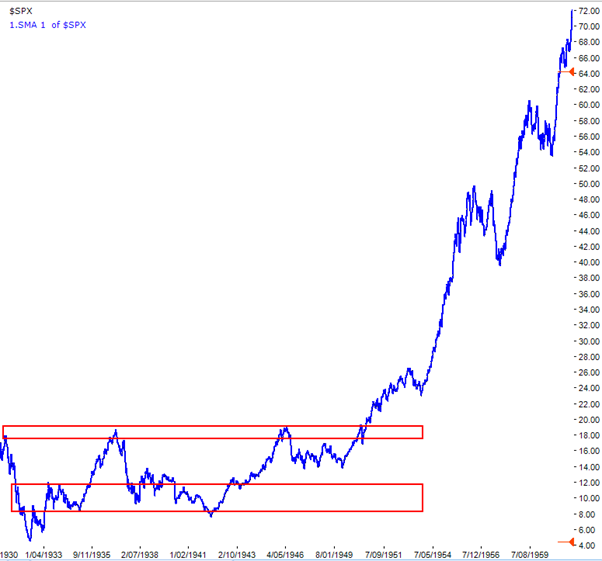
In the chart above, the retracement after the initial breakout was shallow and way above the previous high that is marked by the upper red rectangle.
In October 1982 the initial breakout and the ensuing 5 years looked like this on the S&P500:
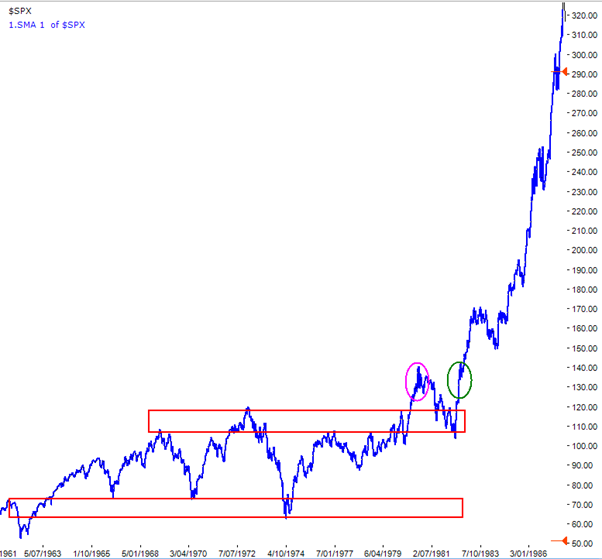
What we don’t know right now, using the clues provided by the past, is whether:
- we are placed at the magenta ellipse,
- we are placed at the green ellipse,
- we are placed at a similar point to just after the breakout in October 1950, or
- the secular bull market will fail and we fall back into the secular bear market range.
In my February blog I discussed the length of secular bear markets. Another observation on this theme is the length of time between the start of secular bull markets. October 1950 to October 1982 was 32 years. October 2013 back to October 1982 is 31 years. A small sample of just two but a cycle worth keeping an eye on.
There are millions of variables that interact with the markets. Regular readers of this blog will know that I harp on about this all time. So a left field outlier could come along at any time and spoil the party but that is a total unknown and total unknowns always exist all the time. We can only go with what we can see, and right now we can see that an obvious bull market is in place. Not a raging one but it could turn into one very quickly…….
From a technical view, and maybe even a fundamental view depending on which fundamental variables you wish to focus (I have discussed 4 key ones in this and the February blog), it may be a bigger risk to be out of this market than in it. Of course, have a risk management plan as all our customers do by knowing in advance what criteria will take them into cash when downturns come along the way.
In conclusion, look for the following signs to indicate that a raging bull market is on the way or even in place:
- private investor activity rising strongly,
- small and mid cap stocks, particularly resource stocks in Australia, start rising in liquidity, price and volumes (they already are in the United States across all sectors).
- the number of new listings (floats) on the ASX starts increasing,
- bad news is discounted by the markets, that is, just takes it in its stride, and good news is magnified by large market increases,
- stocks start being discussed with friends or strangers at dinner parties and in the elevator of your building.
A quote attributed to anon to finish … “people can be divided into three groups: those that make things happen, those that watch things happen and those that wonder what happened.” If this primary bull market persists into a secular bull market similar to the past you don’t want to be in either of the two latter groups, especially if you have an interest in the markets and had been warned……